
AWS Hits 18 Quarter High at 37%, But Meta Just Burned $31B in One Quarter
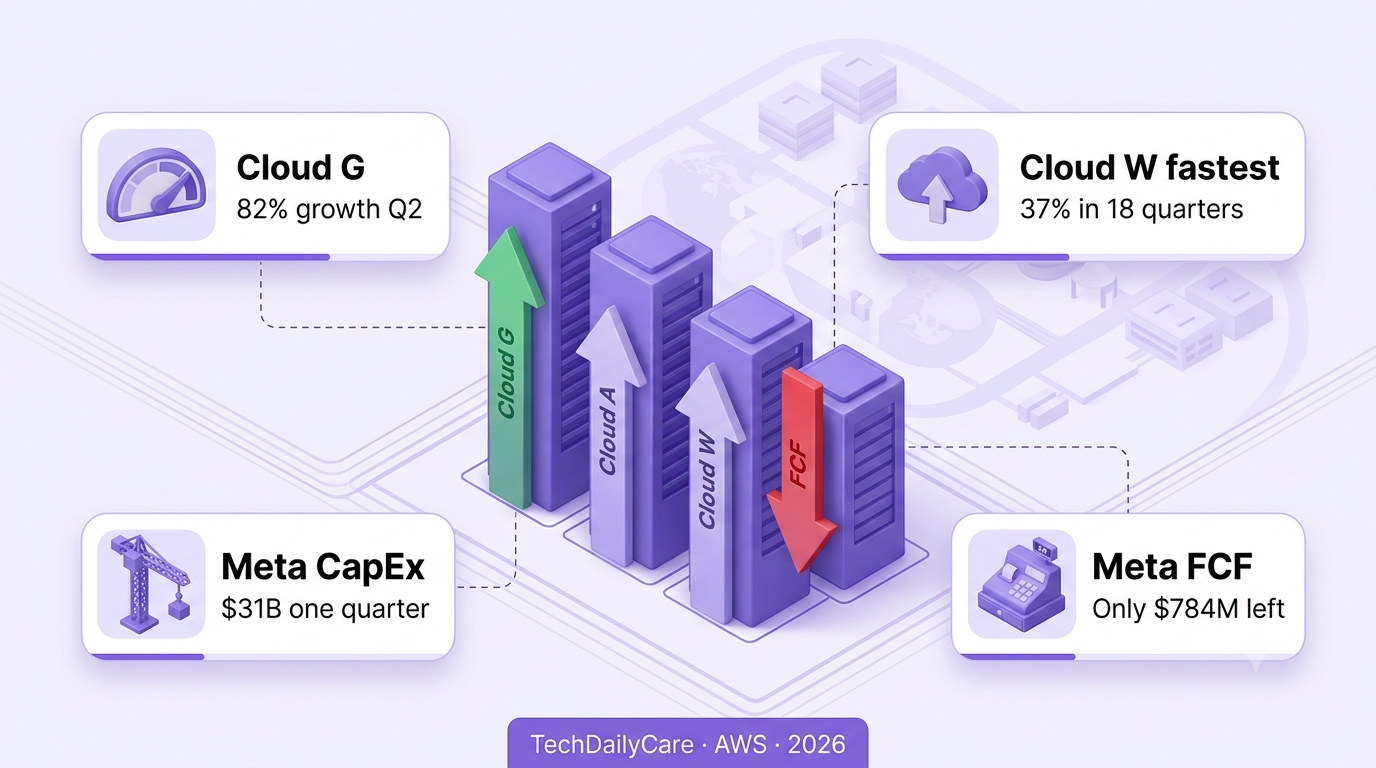
The Q2 Big Tech cloud scorecard is now complete. Google Cloud 82%, Azure 43%, AWS 37% — and Meta’s $31B capex left only $784M in free cash flow.
The Q2 2026 Big Tech cloud scorecard is now complete, and it rewrites the narrative of the last six months. AWS grew 37% year over year in Q2, its fastest pace in 18 quarters, reaching $42.2 billion in revenue and an annualized run rate of $169 billion. Andy Jassy called it booming, and for once that word fits. AWS’s AI business and its in-house chips unit each eclipsed $25 billion annualized run rates — figures that were not even in analyst models at the start of the year. The stock jumped 9.15% after hours. Amazon also crossed $200 billion in total quarterly revenue for the first time.
Stack AWS’s number against the others and the cloud race picture sharpens considerably. Google Cloud grew 82% in Q2 on $24.8 billion in revenue. Azure grew 43% and crossed $100 billion in annual revenue for the first time. AWS grew 37% to $42.2 billion — still the largest cloud by far in absolute revenue, now re-accelerating after several quarters where the growth rate suggested it was losing ground. The three-way scorecard landed exactly as the broken-logic thesis predicted: AI infrastructure capex is working, cloud demand is real, and the Software Selloff that pushed Microsoft below $400 in late July was pricing the wrong scenario.
Then came Meta’s counter-narrative. Meta reported Q2 revenue of $60.8 billion, up 28%, with advertising revenue of $59.4 billion surging on 14% impression growth and 12% price-per-ad growth. The ad machine is not broken — it accelerated. But Meta’s Q2 capital expenditure hit $31.1 billion in a single quarter, consuming 98% of the $31.86 billion in operating cash flow. Free cash flow collapsed 91% year over year to just $784 million. Meta paid $1.35 billion in dividends during the same quarter — more than its entire free cash flow, effectively paying shareholders with borrowed money. Shares dropped 9.64% after hours.
The Q2 2026 cloud cycle produced two simultaneous stories that are both true. AWS proved AI infrastructure spending generates real cloud demand and accelerating revenue. Meta proved that the same AI infrastructure spending can obliterate free cash flow even when the underlying business is growing strongly. Here is what each major print actually shows, why the three-way cloud growth race matters for every enterprise software decision this year, and what the combined capex commitment means for the next 18 months.
What does 18-quarter fastest mean?
AWS hadn’t grown this fast since 2021. The acceleration from 28% in Q1 to 37% in Q2 — a 9-point jump in one quarter — is the strongest sequential re-acceleration the hyperscaler has shown in this AI cycle. Analysts had modeled 31%.
How does $784M FCF happen?
$31.1B Q2 capex consumed 98% of $31.86B operating cash flow. Meta also issued $25B in new long-term debt in Q2 to fund construction. Revenue grew 28%. The ad machine is not the problem — the build program is.
Who won the cloud quarter?
Google Cloud on growth rate (82%). AWS on absolute revenue ($42.2B) and profitability (39.4% operating margin). Azure on milestone ($100B annual run rate). No single winner — each hyperscaler cleared its bar this quarter.
Does this break the Selloff narrative?
The Software Selloff was priced on “AI capex has no ROI.” All three cloud prints show AI demand is real and accelerating. The broken-logic J.P. Morgan thesis is now confirmed by the earnings tape, not just by analyst notes.
AWS Re-Accelerated From 28% to 37% In One Quarter
AWSThe AWS Q2 number requires context to land correctly. AWS had been growing in the high-20s for several quarters while Google Cloud printed 48%, 63%, and then 82% in sequence. The narrative that had built was one of AWS losing ground to Google Cloud and Azure inside AI workloads. Q2 challenges that framing directly.
A 9-point acceleration in a single quarter — from 28% to 37% — is unusually large for a business at $42 billion quarterly revenue. The explanation Andy Jassy gave on the call: demand for AI infrastructure continued to strengthen, and AWS capacity constraints that had been limiting new workload starts in Q1 began to ease as new data center capacity came online. The $54.2 billion in Q2 capital expenditure that investors flinched at is also what enabled the capacity release that produced the 37% number.
The AI and chips units disclosures are the most forward-looking signal in the print. Both businesses eclipsed $25 billion annualized revenue run rates — more than doubling from a year ago, per Jassy. AWS’s in-house chips (Trainium for training, Graviton for general compute) give it a margin lever that neither Google Cloud nor Azure has at the same scale. Custom silicon at $25B run rate makes AWS’s infrastructure economics structurally different from a pure Nvidia-dependent stack.
Meta’s $784M FCF Is The Story Behind The Story
MetaMeta’s Q2 2026 print contains two separate earnings reports that almost every headline merged into one. The advertising business delivered: $59.4 billion in ad revenue, up 27%, on 14% impression growth and 12% average price per ad growth — both metrics accelerating versus Q1. Family daily active people reached 3.60 billion, up 3%. Revenue of $60.8 billion beat the $60.2-60.3 billion analyst consensus. This was not a weak business print.
The other report: $31.1 billion in Q2 capital expenditure consumed 98% of the $31.86 billion in operating cash flow Meta generated in the quarter. Free cash flow fell 91% year over year to $784 million. Meta paid $1.35 billion in dividends — more cash than it had in free cash flow. The company issued approximately $25 billion in new long-term debt in Q2 to fund construction. This is a company borrowing money to pay a dividend while spending nearly all its operating cash on data centers.
The full-year 2026 capex guide narrowed to $130-145 billion from $125-145 billion, meaning management tightened the floor — this is more spending certainty, not less. At the midpoint of $137.5 billion, and assuming operating cash flow runs at the H1 pace for the full year, Meta is structurally FCF-neutral or negative for 2026 as a whole. Zuckerberg’s message was that AI is accelerating the core business and opening enterprise opportunities. The credit market’s answer was higher yields on Meta’s debt issuance — its own way of pricing AI infrastructure risk.
Google Cloud 82% vs AWS 37%: The Gap That Matters
RaceThe 45-point growth rate gap between Google Cloud (82%) and AWS (37%) is the single most strategically important number in the Q2 cloud cycle. AWS is still considerably larger in absolute revenue — $42.2 billion versus $24.8 billion. But if Google Cloud sustains 70%-plus growth while AWS runs in the mid-30s, Google Cloud closes the absolute revenue gap from roughly $17 billion today to less than $10 billion in four quarters. That is a different competitive map than anything the market was pricing in early 2026.
The operating margin comparison adds texture. AWS Q2 operating margin was 39.4%, up from the mid-30s a year ago. Google Cloud Q2 operating margin was 35.6% — its first time above 35%. Azure blends into the broader Intelligent Cloud segment, which ran at about 43% operating margin. All three hyperscalers are now generating meaningful profit from AI cloud services, not just revenue. The loss-leader era for cloud infrastructure is functionally over.
Backlog tells the next chapter. AWS backlog reached $496 billion, up from $263 billion a year ago — nearly doubling. Google Cloud’s comparable RPO figure was $514 billion, a $50 billion sequential add. Microsoft’s commercial RPO was $678 billion. All three have visibility profiles measured in years rather than quarters. The AI infrastructure demand that is driving current growth is not spot demand — it is contracted, multi-year, and growing.
The Combined AI Capex Is Now $700B+ Annualized
ScaleAdd up the annualized capital expenditure guidance from the four companies that reported last week and the number is staggering. Alphabet: $195-205 billion for FY2026. Microsoft: approximately $175 billion for FY27. Amazon: approximately $220 billion for FY2026 (raised from $200 billion). Meta: $130-145 billion for FY2026. The combined midpoint is roughly $720-730 billion — a figure that would rank as the 18th-largest economy in the world if it were GDP.
This scale of spending has no historical precedent in peacetime corporate capital allocation. The closest comparison is the late-1990s telecom buildout, which ended badly for most participants. The difference this time is that the hyperscalers are building on their own balance sheets rather than with leveraged debt, cloud demand is already monetizing at scale rather than speculative, and all three major cloud businesses are operating profitably. The risk profile is not 1999 — but the scale of commitment means any demand slowdown will be felt deeply and quickly across the entire tech supply chain.
For enterprise technology buyers, the capex commitment signals something important: cloud capacity is coming at massive scale over the next 24 months. Data center construction that is funded today begins delivering capacity in 2027 and 2028. Enterprise customers negotiating multi-year cloud commitments in 2026 are doing so into a supply environment that will be materially looser by the time their contracts begin running at full scale. That negotiating dynamic will reshape cloud pricing in ways that are not yet visible in the reported numbers.
AWS Backlog $496B Means The Demand Is Contracted, Not Speculative
VisibilityAndy Jassy disclosed on the Q2 call that AWS backlog — contracted work that has not yet been recognized as revenue — reached $496 billion during the quarter, up from $263 billion a year ago. An 88% year-over-year increase in backlog is a signal that enterprise customers are not window-shopping AI cloud capacity; they are signing long-term commitments. At Q2’s $42.2 billion quarterly revenue pace, $496 billion represents nearly three years of forward revenue coverage.
The backlog growth also validates the capex investment case in a way that no amount of quarterly revenue growth can. Quarterly revenue can be pulled forward from future commitments, inflated by one-time deals, or seasonal. A backlog that nearly doubled year over year is structural contracted demand — customers have signed legal commitments to spend, typically with multi-year minimum consumption thresholds, and AWS will recognize that revenue as they consume the capacity. The $220 billion in FY2026 capex that Amazon is building toward has $496 billion in contracted demand behind it.
The comparable figures — Google Cloud’s $514 billion RPO and Microsoft’s $678 billion commercial RPO — form a collective picture of the enterprise AI demand landscape. The three hyperscalers together have contracted forward revenue of roughly $1.7 trillion in remaining performance obligations. Even if growth rates normalize toward 25-30% over the next two years, the runway is visible and the underwriting is done.
The Broken-Logic Thesis Just Got Confirmed By The Tape
MarketJ.P. Morgan Research published analysis earlier this year calling the Software Selloff driven by “broken logic” — two AI fears that cannot simultaneously be true. Fear one: AI will eat SaaS revenue (selling Salesforce, Adobe). Fear two: AI capex generates no ROI (selling Microsoft, Alphabet). If AI is powerful enough to disrupt SaaS, it is by definition generating returns. If capex generates no returns, AI is not powerful enough to disrupt SaaS.
The Q2 earnings cycle resolved the contradiction in favor of the capex-is-working thesis. Google Cloud grew 82%. AWS grew 37% at its fastest pace in 18 quarters. Azure grew 43%. All three hyperscalers expanded operating margins while investing at historic capex levels. The demand is contracted, not speculative. The unit economics are improving, not deteriorating. The Evercore analysts who had worried about Google Cloud raising concerns of share shifts walked back that concern as AWS confirmed co-acceleration. The tape says AI capex is ROI-positive at the hyperscaler level — which means Fear Two is wrong, which should stabilize the SaaS repricing overshoot as well.
Microsoft stock jumped 7% after its Q4 earnings, back above $400. Amazon jumped 9.15% after its Q2 print. Alphabet recovered from its post-earnings dip as the broader cloud narrative consolidated positive. The Software Selloff that dominated coverage through mid-July has lost its primary thesis. What replaces it — in the absence of a macro shock — is a more differentiated story where per-seat SaaS with weak AI value-add gets repriced, and cloud infrastructure with AI demand confirmation gets re-rated higher.
AWS is booming, growing 36.7% year-over-year in Q2,
our fastest growth in 18 quarters.
- AWS Q3 growth rate — Does 37% hold or accelerate? Sustaining above 35% for a second quarter would confirm the re-acceleration as structural rather than a single-quarter spike from capacity release.
- Google Cloud Q3 growth — Sustaining 70%+ confirms it is structural. A step-down to 55% signals Q2 was partly tactical. Third quarter is the validation print.
- Meta FY2026 full-year FCF — If H2 capex holds at the H1 pace, Meta is on track for near-zero free cash flow for the year. Watch whether Q3 capex narrows toward the bottom of the $130-145B guide or pushes the top.
- Amazon FY2026 capex revision — Raised to $220B from $200B this quarter. Any further raise in Q3 guidance signals demand is running ahead of build capacity again.
- Cloud pricing dynamics — All three hyperscalers have massive capacity coming online in 2027-2028. Enterprise customers negotiating now should be benchmarking against future supply-surplus pricing, not current constrained rates.
- AWS AI and chips run rate — Both exceeded $25B annualized this quarter. The next milestone is $50B. Track whether Jassy discloses a combined number on Q3 call or keeps them separate.
- Meta enterprise AI pivot — Zuckerberg said AI is opening enterprise opportunities. Any concrete Anthropic cloud compute deal announcement or developer platform launch on the Q3 call would materially shift the Meta investment thesis.
⚠️ Four Q2 Cloud Scorecard Reading Traps
1. Assuming Google Cloud 82% is the new normal. Three quarters of sequential acceleration is a strong trend signal, but the law of large numbers will compress the growth rate over time. Google Cloud’s absolute revenue is still roughly half of AWS. Sustaining 80%+ requires continuing to expand share in a market where AWS is also re-accelerating.
2. Reading Meta’s FCF collapse as an ad business problem. Meta’s advertising revenue grew 27% and price-per-ad grew 12%. The FCF issue is entirely capex-driven. Conflating the two produces the wrong investment conclusion. The ad business is healthy; the build program is absorbing every dollar it generates.
3. Treating $700B in annualized capex as a permanent feature. Capex cycles peak and roll over. Alphabet explicitly raised its full-year guide; Amazon raised its; Meta narrowed the floor. But management teams at all four companies have been clear that capex growth will eventually moderate once the AI infrastructure base is built. The $700B figure is a peak cycle number, not a steady-state.
4. Missing the supply easing signal in AWS’s commentary. Jassy noted Q1 capacity constraints started easing in Q2. If supply becomes available faster than demand absorbs it — which is possible as $700B in capex simultaneously comes online — cloud pricing pressure could emerge in 2027 before the backlog converts to revenue at the current rate.
AI is accelerating our core business today,
powering our next generation of products.