
Google Cloud Doubled Azure Growth to 82%, Alphabet Stock Fell Anyway
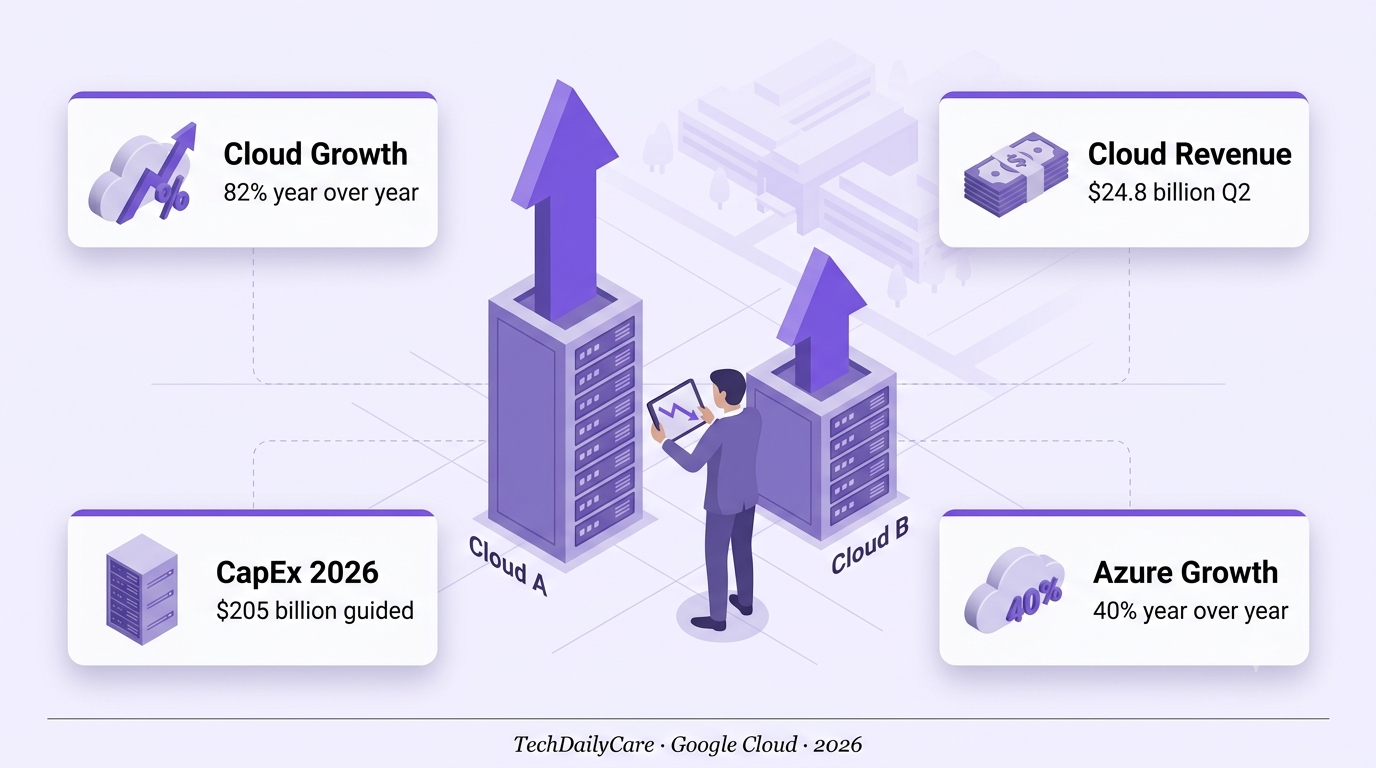
Q2 Cloud revenue hit $24.8B. Backlog swelled to $514B. Yet Alphabet dropped 3.65% after hours as capex guidance climbed to $205B.
Google Cloud just posted the most important quarter of its history. Alphabet reported Q2 2026 revenue of $119.8 billion on Wednesday July 22, up 24% year over year. Inside that number, Google Cloud revenue accelerated to $24.8 billion, up 82% YoY. That is more than double Microsoft Azure’s 40% growth in the same quarter, and a meaningful step up from Google Cloud’s own 63% growth in Q1 and 48% growth in Q4 2025. The gap between Google Cloud and Azure is now the widest it has been since Google Cloud broke $1 billion in quarterly revenue.
The unit economics finally caught up too. Google Cloud operating income tripled to $8.8 billion from $2.8 billion a year earlier. Cloud operating margin expanded to 35.6% — the first time Google Cloud has cleared 35% in its history. Backlog rose by more than $50 billion sequentially to $514 billion, a signal that enterprise commitments are getting locked in for multi-year AI infrastructure spend. This is not the “loss-leader” Google Cloud that skeptics used to point at for years. It is a business that finally looks like the third leg of Alphabet.
Then the stock fell. Alphabet dropped 3.65% in after-hours trading to $329.43 as investors focused on the capex line. Q2 alone burned $44.9 billion in capital expenditure, more than doubling YoY. Full-year 2026 capex guidance was raised to $195-205 billion, and Alphabet warned 2027 capex will “increase significantly” beyond that. Free cash flow flipped to negative $5.9 billion. For a company that has historically printed $60-plus billion in annual free cash flow, an FCF-negative quarter is a shock to the risk model.
This is the Google Cloud paradox in 2026: the operating results are the best they’ve ever looked, and the stock still fell. The Wall Street question isn’t whether Google Cloud is winning. The Wall Street question is whether Alphabet can afford to win at this pace. Here is what the 82% growth quarter actually shows, why the market punished the print anyway, and how it changes the Cloud market map heading into Microsoft, Meta, and Amazon earnings over the next week.
How fast did Google Cloud actually grow?
Revenue up 82% YoY to $24.8 billion. Third straight quarter of accelerating growth (48% → 63% → 82%). Operating margin tripled to 35.6%. This is Google Cloud’s best quarter ever on almost every metric.
What does $514B in backlog mean?
Multi-year enterprise commitments locked in. Backlog swelled by $50B sequentially. That is roughly 20 quarters of revenue coverage at Q2 pace — a rare visibility profile for a hyperscaler.
Why did the stock still fall?
2026 capex guidance raised to $195-205B. Q2 capex hit $44.9B alone (+100% YoY). Free cash flow flipped to negative $5.9B. Investors are pricing “how much longer” not “if this works.”
What does this do to the cloud map?
Google Cloud is now clearly the fastest-growing hyperscaler. Azure and AWS still have larger absolute revenue, but the trajectory has flipped. If Q3 holds pace, Google Cloud closes the absolute-scale gap on Azure meaningfully in 2027.
The 82% Growth Isn’t Base-Effect Noise
TrendGoogle Cloud grew 48% in Q4 2025. Then 63% in Q1 2026. Then 82% in Q2 2026. Three sequential quarters of acceleration is not what a low-base bounce looks like. It is what a business finding sustained enterprise demand looks like. And the absolute dollar growth is meaningful too — Google Cloud added roughly $11 billion in YoY revenue in Q2 alone, up from about $9 billion in Q1.
The step function matters because it changes the argument about Google Cloud’s competitive position. For years the skeptics have said Google Cloud was structurally third in the hyperscaler race behind AWS and Azure, and would remain a distant third. Q2 challenges that framing directly. If Google Cloud can hold 80%-plus growth for another quarter, it stops being a #3 story and becomes a competitive-repricing story for the entire cloud market.
The pieces of the acceleration are clear from the earnings call. Enterprise AI workloads on Vertex AI and Gemini models continue to expand. Google’s TPU capacity — v6 Trillium and Ironwood — is a differentiated compute stack that OpenAI competitors and model labs are increasingly interested in. Large customers are running more apps on Google Cloud infrastructure, and Google’s search-adjacent AI expertise is becoming a real enterprise sales lever. This is the tape that Sundar Pichai has been arguing for on every call for two years, finally showing up as a number.
Operating Margins Tripled To 35.6%
ProfitabilityThe margin story is arguably more important than the revenue story. Google Cloud operating income was $8.8 billion in Q2, up from $2.8 billion a year earlier — a 214% increase. Operating margin expanded to 35.6%, the first time in the segment’s history it has cleared the 35% line. AWS operates in the mid-to-high 30s. Azure blends into Microsoft’s overall Cloud segment but Intelligent Cloud typically prints in the 40s. Google Cloud is now within striking range of both.
The margin expansion undercuts one of the most common bear arguments about Google Cloud — that the business would scale revenue at low or negative operating margin because it was subsidizing customer acquisition to catch up. Q2 shows the opposite. Google Cloud is now scaling revenue faster than either competitor and expanding margins at the same time. That is unusually rare in cloud infrastructure and it implies either operational leverage from prior investments finally kicking in, or pricing power that Google Cloud did not previously have.
Management did flag modest margin pressure in Q3 from using third-party capacity as a bridge to meet demand. That is a fascinating disclosure — Google Cloud is capacity-constrained, and Alphabet’s own $44.9 billion capex quarter still isn’t enough to keep up with the enterprise pipeline. The Q3 margin will step down slightly, but the direction is unmistakable: this is a business that finally has the unit economics to justify the capex.
The $514 Billion Backlog Is The Real Story
VisibilityGoogle Cloud’s backlog — remaining performance obligations, in accounting terms — grew by more than $50 billion sequentially to $514 billion. That is the single most under-reported number from the print. At Q2’s roughly $25 billion revenue pace, the backlog represents about 20 quarters of forward revenue coverage. A hyperscaler with five years of visible commitments is a fundamentally different risk profile than one selling quarter-to-quarter.
The backlog build reflects multi-year enterprise AI infrastructure commitments. Anthropic, OpenAI, and several other frontier labs have publicly announced multi-billion-dollar Google Cloud commitments over the past 12 months. Meta reportedly is in talks with Anthropic to lease up to $10 billion in computing capacity over two years, potentially bringing new hyperscaler competition. Fortune 500 enterprises are locking in AI compute at scale to avoid capacity constraints in 2027 and 2028.
What’s changed is who is signing. Two years ago Google Cloud’s backlog was concentrated in a few very large deals. Q2 disclosures suggest it is broadening, with mid-market enterprise workloads and multi-year Gemini commitments showing up in the numbers. Sundar Pichai told the call that baseline capacity is allocated to Alphabet’s internal AI needs first, then to customers with committed backlog, then to spot demand — an ordering that implies the backlog is real commercial commitment and not renewals-at-a-discount.
The $205B CapEx Is Why The Stock Fell
CostAlphabet raised full-year 2026 capex guidance to $195-205 billion. Q2 alone burned $44.9 billion, up 100% YoY. Free cash flow turned negative for the quarter at -$5.9 billion — the first FCF-negative quarter for Alphabet since 2010. This is what set off the 3.65% after-hours drop, not the growth numbers. Investors know the growth is real. They are questioning whether the cost structure to support it is sustainable.
To fund the buildout, Alphabet raised $49.6 billion by issuing stock in June and brought in $20.3 billion from senior unsecured notes in Q2. This is a company that has historically been a net share-buyer and a debt-free balance sheet story pivoting to net share-issuance and material debt to finance AI infrastructure. That is a defensible strategy at 82% Cloud growth and a $514B backlog, but it is a different Alphabet than the one Wall Street was pricing 18 months ago.
Then came the punchline. Alphabet warned 2027 capex will “increase significantly” from the $205B guidance level. The market interpreted that as “not yet at peak.” Analysts are now modeling 2027 capex in the $240-270B range. For context, that is more than the entire annual GDP of countries like Portugal or New Zealand, spent by a single company in a single year. The AI infrastructure buildout is not slowing down — it is compounding.
Google’s Antigravity Coding Tool Quietly Reached 2.4M WAU
SleeperBuried in the Q2 disclosures was a number that developer-tools investors will care about disproportionately: Google’s Antigravity AI coding tool now has 2.4 million weekly active users. Antigravity was launched with relatively little marketing fanfare and has been growing largely on word of mouth inside enterprise engineering teams. 2.4M WAU puts it firmly in the same conversation as Cursor and Windsurf as a serious AI coding assistant, and it is a native part of the Google Cloud ecosystem in a way that neither Cursor nor Anthropic-adjacent tools can claim.
The strategic implication is that Google Cloud is not just selling raw compute — it is building out the developer surface on top of it. Every Antigravity user is a potential Vertex AI customer, a potential Gemini API customer, and a potential enterprise decision-maker who pulls their team toward Google Cloud when the workload migration decision comes up. This is the same playbook Microsoft ran with GitHub Copilot and Azure, and it is arguably why Azure enterprise attach has held up as long as it has.
2.4M WAU is not the largest number in AI coding — Copilot enterprise likely runs bigger, Cursor’s user base is comparable — but the growth curve and the enterprise attach potential are the interesting parts. If Antigravity keeps compounding at this pace through 2027, Google Cloud has a second growth engine adjacent to raw infrastructure that changes the total addressable business.
What This Means For Microsoft, Meta, And Amazon
Read-ThroughMicrosoft reports July 30. Meta reports July 29. Amazon reports July 30. Google Cloud’s 82% print resets expectations for all three. Investors will now hold Azure to a higher bar. Anything less than 40% Azure growth will be read as Google Cloud stealing share. Anything above 45% will be seen as strong enough to support Microsoft’s own capex commitments. The read-through window is narrower than it was 48 hours ago.
Meta is the more complicated situation. Meta is reportedly in talks to lease up to $10 billion in AI compute to Anthropic over the next two years — a move that would put Meta into the cloud infrastructure business it has historically avoided. If Meta confirms that pivot on the July 29 call, the hyperscaler map officially expands to four. Alphabet, Microsoft, Amazon, and Meta all fighting for enterprise AI capacity is a different competitive setup than the three-horse race investors have modeled for a decade.
Amazon and AWS are the most exposed to Google Cloud’s Q2 print. AWS Q1 growth was in the high 20s. If Q2 does not accelerate meaningfully, the market will read AWS as losing share to Google Cloud in AI-driven workloads specifically. Amazon’s stock has already lagged into earnings for exactly this reason. A weak AWS growth number on July 30 could extend the Software Selloff into August. A strong number could break the pattern and rebuild sentiment across cloud infrastructure.
One of the strongest revenue growth quarters
Alphabet has had in five years.
- Microsoft Azure Q3 growth (July 30) — Anything below 40% will be read as Google Cloud stealing share. Above 45% keeps Azure competitive on trajectory.
- Amazon AWS Q2 growth (July 30) — The single most-watched cloud number of this earnings cycle. Below 25% is a sell signal. Above 30% is a stabilization signal.
- Meta cloud disclosure (July 29) — Formal confirmation of the reported $10B Anthropic compute lease would establish Meta as the fourth hyperscaler and reshape competitive dynamics.
- Google Cloud Q3 growth — Sustaining 70%-plus growth for another quarter confirms the acceleration is structural. Step down to 55% would signal Q2 was a spike.
- Backlog conversion rate — The $514B backlog needs to keep converting into recognized revenue at the current pace. Watch RPO commentary on future calls.
- Antigravity WAU trajectory — 2.4M today. If it hits 5M+ by year-end, Google Cloud has a second material growth engine developing.
- 2027 capex guidance clarity — Vague “significant increase” language will keep the FCF-negative overhang on the stock. Specific numbers, even if high, would help reduce uncertainty.
⚠️ Four Google Cloud Reading Traps
1. Assuming 82% growth persists. The Q2 number is remarkable but it is one quarter. Base effects, one-off deal timing, and pull-forward from constrained capacity can all inflate a quarterly print. Sustained trajectory needs at least one more quarter of confirmation.
2. Ignoring the capex cost. Free cash flow turned negative $5.9B and Alphabet is issuing stock to fund the buildout. This is a different Alphabet than the one Wall Street modeled 18 months ago. The story is more growth-at-cost than growth-for-free.
3. Reading Cloud growth as Alphabet resilience. The Cloud segment is roughly 20% of consolidated revenue. Even at 82% growth, it does not offset a Search or YouTube slowdown. Alphabet’s overall picture still depends heavily on advertising performance.
4. Treating hyperscaler capex as fixed. Google’s $205B guidance and Meta’s rumored move both raise the sector-wide AI infrastructure spend. If AI demand normalizes rather than accelerates, the industry has committed to capex the return math no longer supports.
Baseline capacity is allocated to Alphabet first,
then to customers with committed backlog.